The Jedi Motion Lab
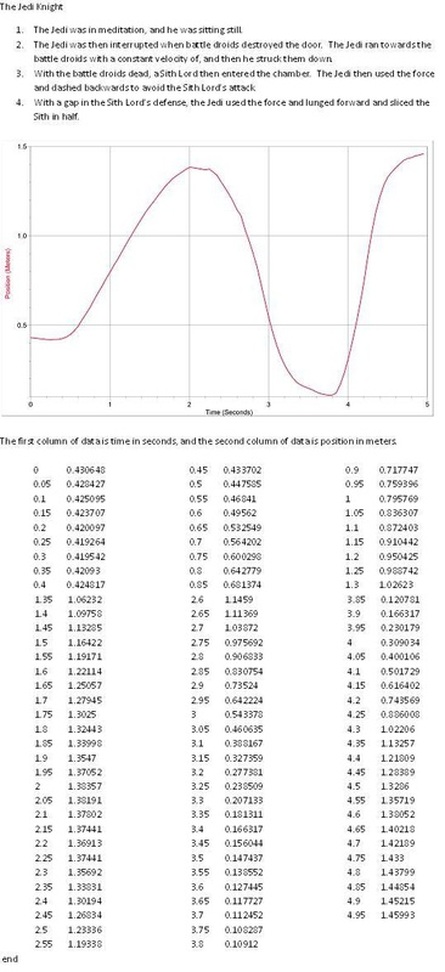
Lab: Interpreting and Matching
Displacement vs. Time Motion Graphs
Objectives:
- Create a Displacement vs. Time graph and match your graph with actual motion.
- Gain competence in the use of motion detector and related equipment.
- Understand the relationship between position vs. time, velocity and acceleration.
Materials:
TI-84 Calculator-Based Lab Unit (CBL-II)
Motion detector
Meter stick
Computer with LoggerPro software
Procedure:
Part I –
1. Develop a position vs. time story that describes a body in motion incorporating at least the following four types of motion.
i. standing still
ii. moving with constant velocity
iii. moving with variable negative velocity
iv. moving with variable positive velocity
2. Illustrate the story on a position vs. time graph. Use a legend to cross reference sections of the graph with the corresponding sections of the story.
3. Underneath the graph, write instructions for moving in front of the motion detector according to the graph you have drawn (see page 2 for example).
Part II – AT THE LAB STATION IN CLASS WITH A PARTNER
4. Measure out and mark meaningful locations on the floor and practice the motion needed to create the position vs. time graph.
- Now it’s time for you to match your physical motion to your group’s descriptive motion graph. You have 3 attempts to match it as best you can. Save a copy best graph your motion creates and reproduce this graph using LoggerPro.
Discuss differences between the descriptive graph and the graph generated by the motion detector. What are the reasons for the differences?
The main difference between the two was that the motion generated graph wasn't as sharp as the hand-drawn graph. The reason for this is that that sharpness comes from the inhuman ability to instantaneously change the direction of our velocity, so we get more smooth curves than sharper points.
